Neuroscience: Mental Health
Zhang et al., 2023. Personality traits and brain health: A large prospective cohort study. Nat. Ment. Health.
Personality has been found be influence the risk of several brain disorders, although the mechanism and causality have not been formally established. This study provides a large-scale analysis of the relationships between personality traits and brain disorders in UK Biobank. Further analyses investigated how these relations may be mechanically linked to genetics, brain structure, and immunometabolic biomarkers.
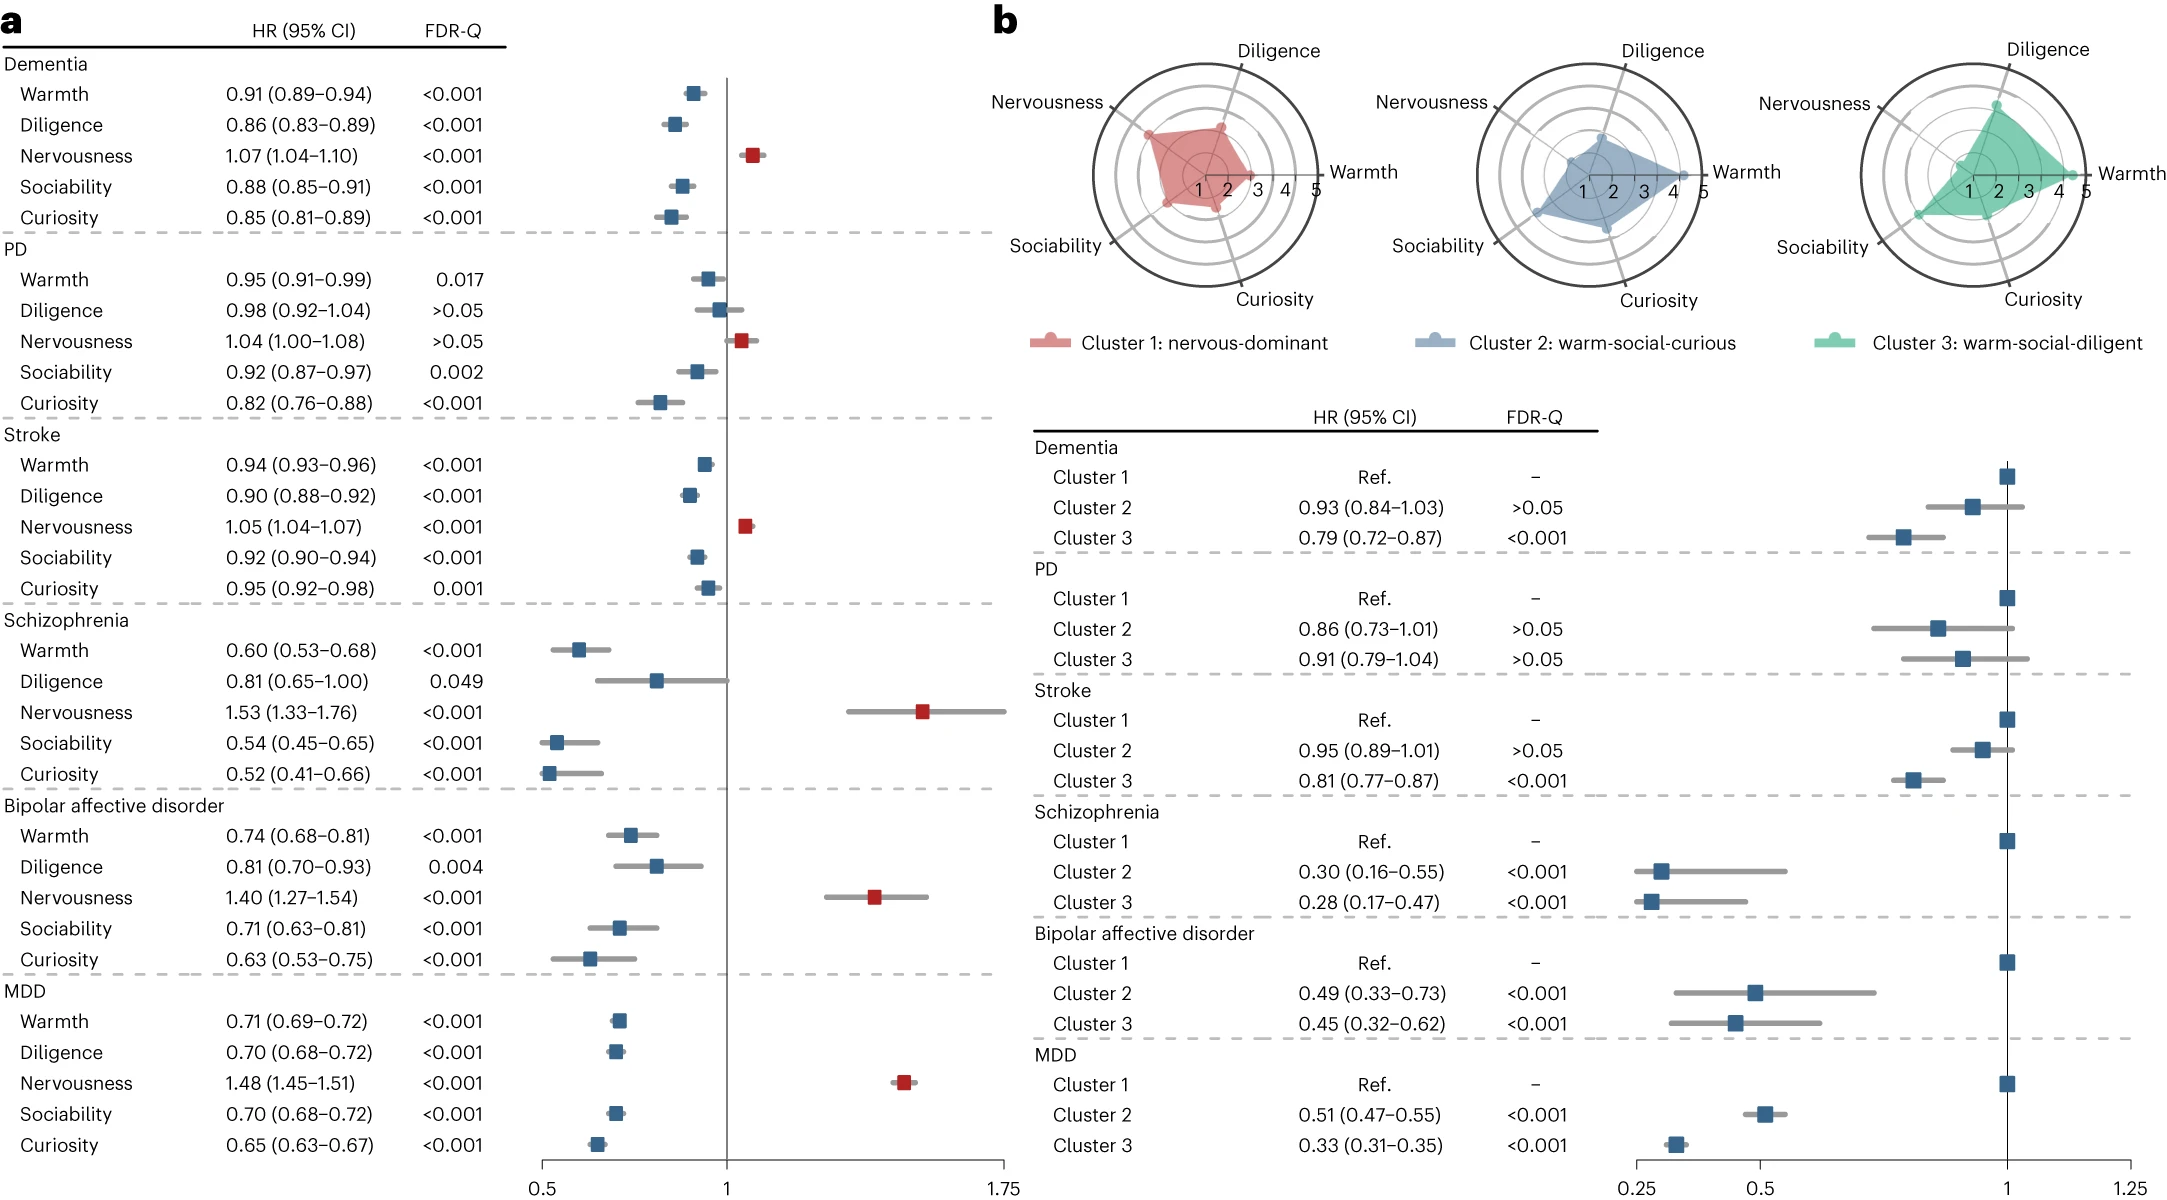
- Cox proportional hazards models showed that nerviousness increases the risks of all 7 investigated disorders (dementia, Parkinson’s disease [PD], stroke, schizophrenia [SCZ], bipolar affective disorder [BD], major depressive disorder [MDD]), while warmth, diligence, sociabiliy, and curiosity decease the risks for most. However, the effect sizes are generally very small for dementia, PD, and stroke. When the analysis was performed on clusters of personality traits instead, the warm-social-curious and warm-social-diligent clusters had the most impact on SCZ, BD, and MDD, reducing risk down to 25-50%.
- Genome-wide association study (GWAS) and Mendelian randomisation (MR) analyses showed potential causal relationships between personality traits and some of the brain disorders. Most prominently, all 5 personality traits were moderately or strongly linked to MDD.
- Brain structure correlates were examined for personality traits, but not in relation with brain disorders it seems. Not much intersting results for me.
- Structural equation modelling (SEM) analysis showed that immunometabolic biomarkers mediate the associations between most personality traits and brain disorders.
Young et al., 2024. Data-driven modelling of neurodegenerative disease progression: Thinking outside the black box. Nat. Rev. Natsci.
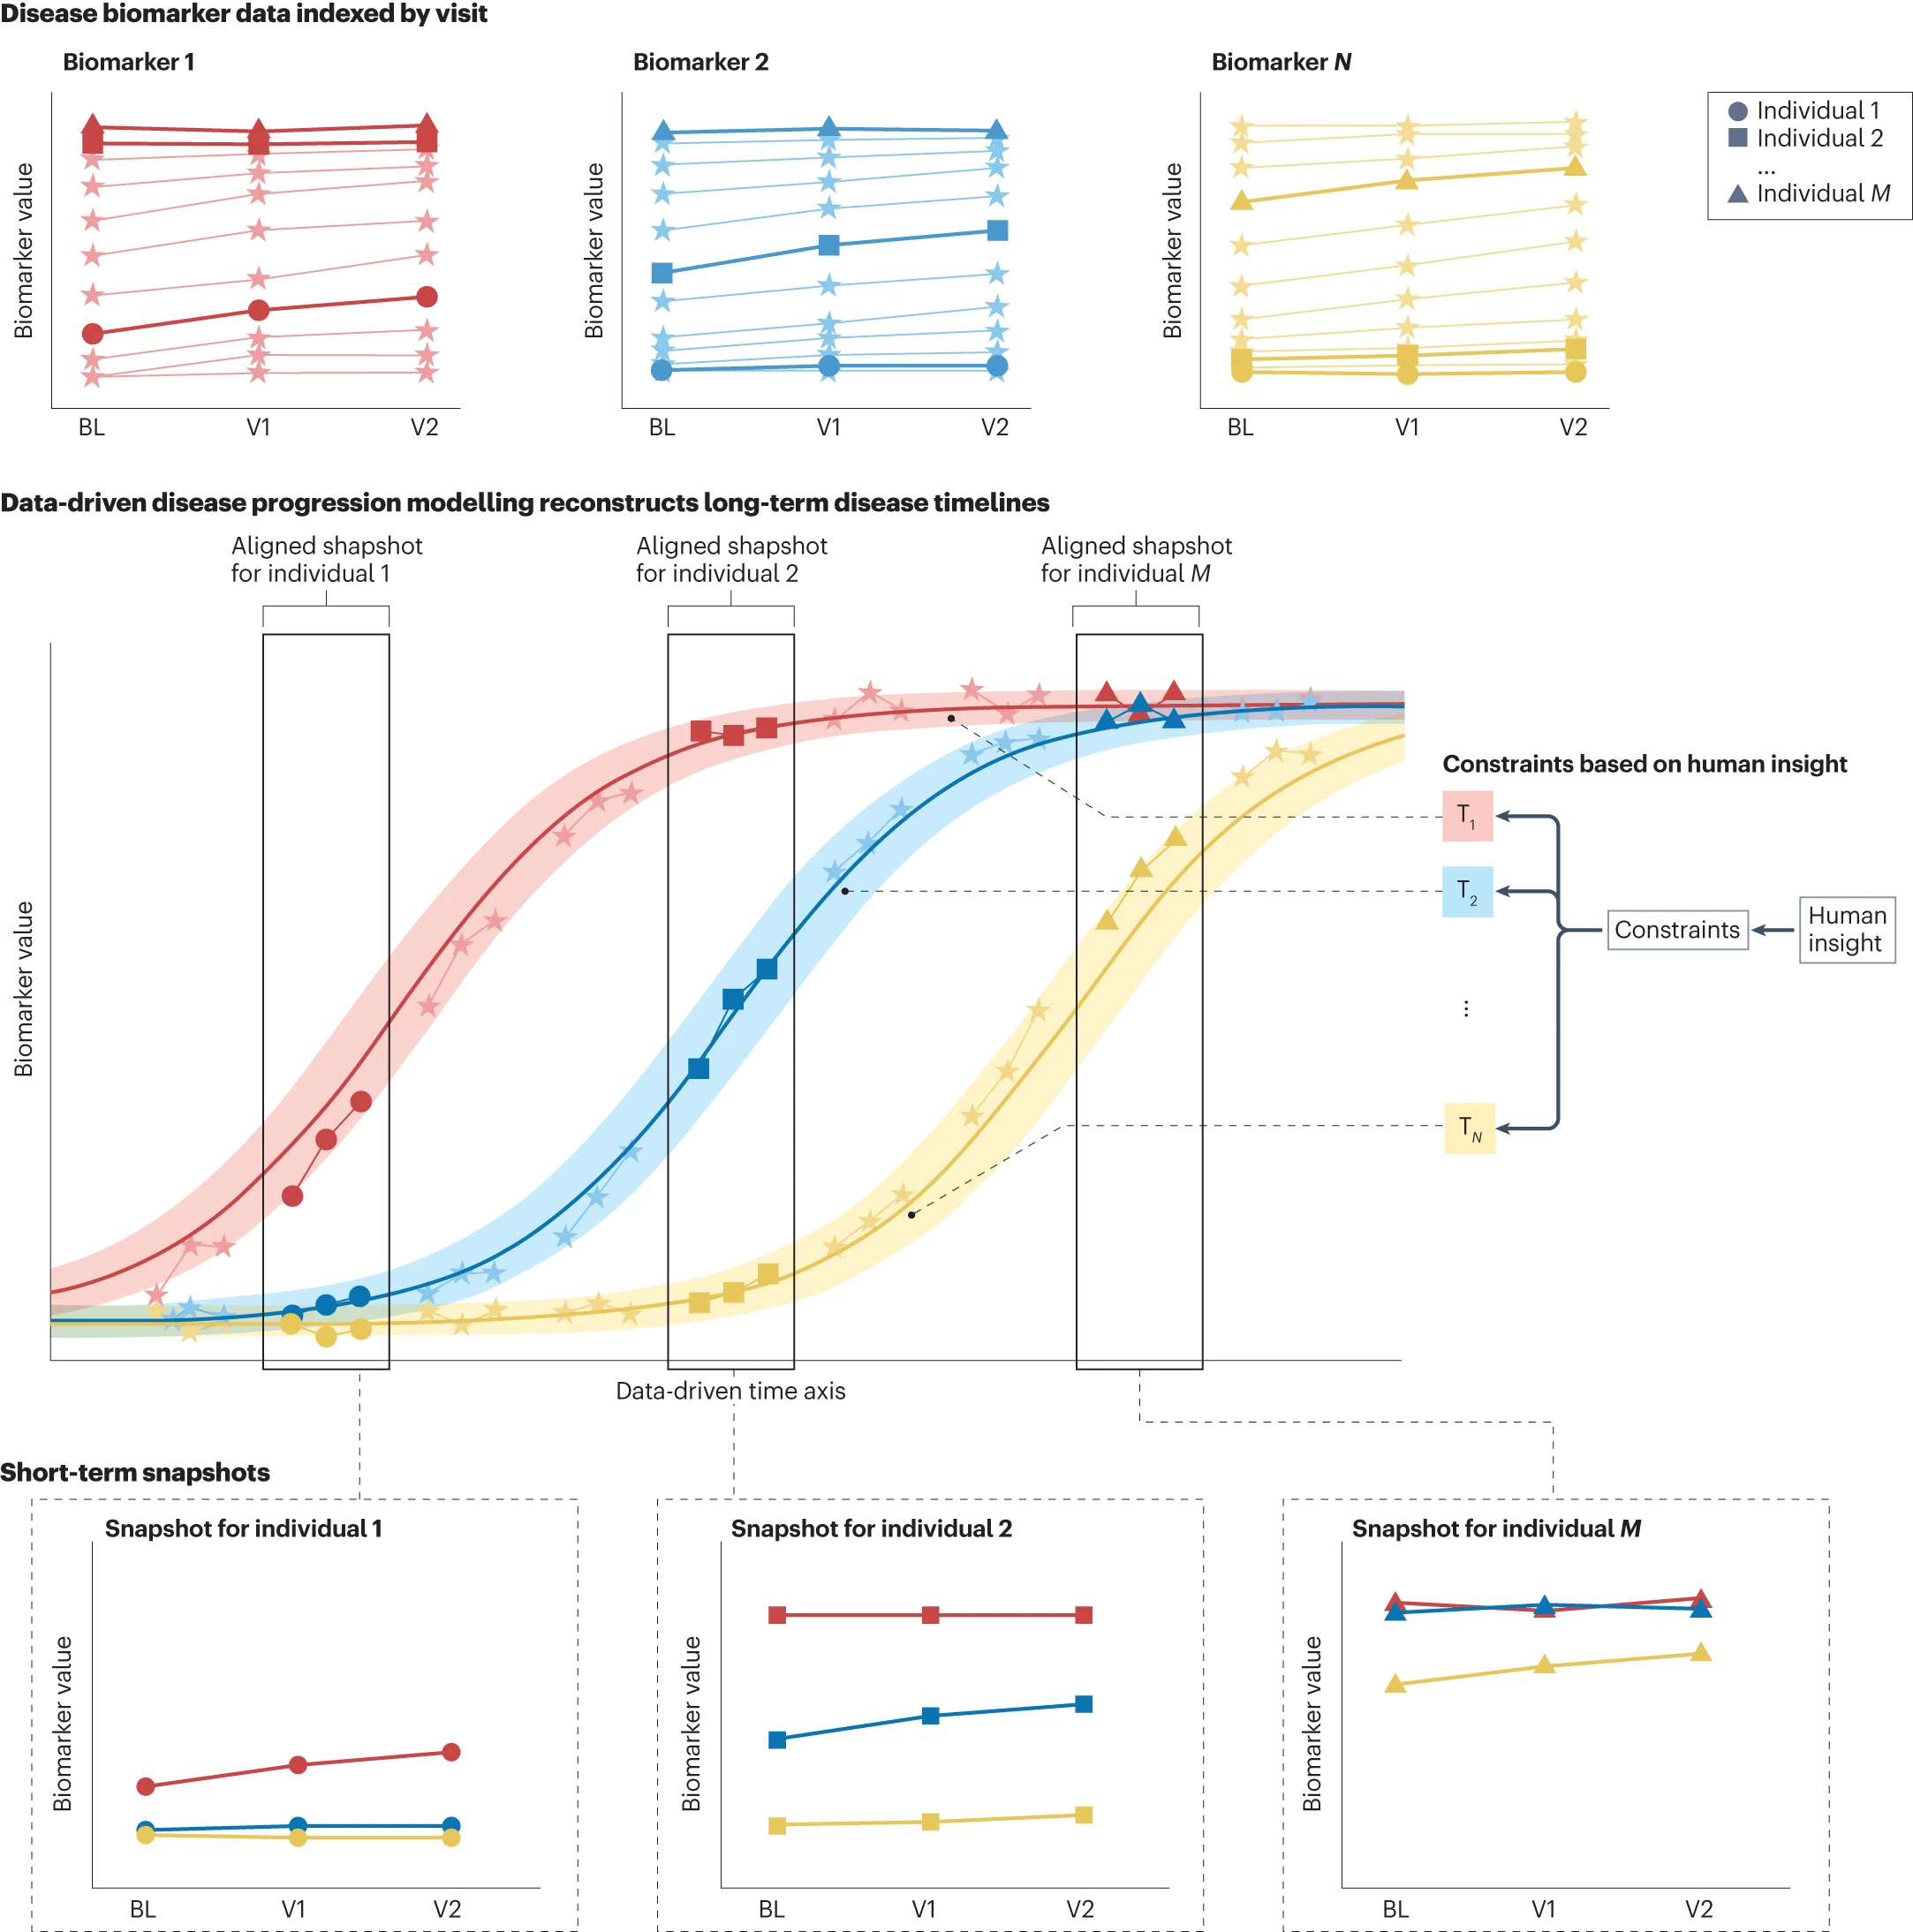
Mapping disease progression generally requires longitudinal data that are difficult to acquire. This study reviews an emerging set of tools called data-driven disease progression models, which can infer disease progression/timeline only using short-term data. The authors defined these models with 2 key features:
- A generative model is used to data-driven inference of the disease timeline.
- The model is directly informed by measured in vivo biomarker data.
The general framework for data-driven disease progression modelling is that short-term progression data from individual participants in different time periods can be fitted on the same progression timeline curve. Currently, these modelling approaches can be categorised into two sets, phenomenological models and pathophysiological models, aiming respectively to capture disease trajectories common across participants and to assess hypotheses on the underlying biological and physical processes. Specific models are listed for phenomenological models and pathophysiological models, which may be useful to read in more details when they become more relevant.
Thoughts: overall, this field is still in an early stage. Challenges exist in many aspects of data and study design. The features and targets are very diverse, meaning that large-scale comparative studies are difficult to do. It may be possible, still, to do some benchmarking studies with specific diseases in mind.
Cognitive Neuroscience: Behaviour Prediction
Gal et al., 2022. Predicting individual traits from unperformed tasks. NeuroImage.
It is well recognised that task functional magnetic resonance imaging (t-fMRI) data are more useful than the resting-state equivalent (rs-fMRI) for predicting interindividual varaibility in behavoural phenotypes. However, t-fMRI acquisition is also more challenging and thus less commonly done compared to resting-state. This study suggested that task activation maps can be predicted/constructed from resting-state functional connectivity (RSFC), without the need for subjects to have performed the task, and then can be used to predict individual behavioural traits.
- Human Connectome Project (HCP) data from 847 participants were used. Task acivation map prediction models were trained on 100 unrelated subjects. The remaining 747 subjects were used for G-score prediction based on their predicted task activation maps in a 10-fold cross-validation (CV).
- Task activation map prediction (connTask-based model) was based on Tavor et al., 20161 (maybe worth further reading). Behavour prediction was performed using the Brain Basis Set pipeline from Sripada et al., 2019 and 20202,3. Specifically, elastic net was used with a nested 5-fold CV for tuning L1 ratio and penalty factor.
- Prediction of G-score was using the connTask-based model was significantly better than the RSFC-based model , but worse than the model based on the original task activation maps. The best models tend to be combinations of working memory (WM) and other tasks, with small differences in prediction accuracies of at least the top 5 models.
Thoughts: I need to take a look at the Tavor paper to see how the task activation map prediction works and if there is any concern of leakage. It would also be nice to see how well these results generalises to different datasets, which will actually test the practical utility of this approach.
Schulz et al., 2024. Performance reserves in brain-imaging-based phenotype prediction. Cell. Rep.
This study examines the trend of behaviour prediction performance with increasing sample size in UK Biobank. The prediction accuracy vs. sample size curved can be quite exactly fitted to a power law function of the form $\alpha n^{-\beta} + \gamma$. Extrapolation of the curves showed potential additional improvement in prediction performance.
Thoughts: even with extrapolated curve at $10^6$ sample size, the prediction accuracy of fluid intelligence was only $R^2 \sim 0.15$, and even lower for personality traits like neuroticism ($R^2 \sim 0.04$). Even with the very large sample size, UK Biobank is not the best dataset to investigate behaviour prediction in cognition and personality domains.
Tetereva et al., 2025. Improving predictability, reliability, and generalizability of brain-wide associations for cognitive abilities via multimodal stacking. PNAS Nexus.
This study investigated the prediction of total cognition using multimodal neuroimaging data via stacking.
- Overall, elastic net based and “Stacked: All” models resulted in the best or close to the best prediction performance in all 3 datasets.
- Among the different features, task contrasts generally led to top-performing models, in particular the working memory (WM) task from HCP Young Adult, and the facename task (a paired-associates memory task) in HCP Aging and Dunedin Study.
- Models based on structural MRI features have the highest test-retest reliability, though “Stacked: All” models generally have excellent intraclass correlation (ICC) as well.
- Generalizability is overall low, but slightly higher for stacked models than nonstacked models.
Thoughts: task contrast vs. task FC, the practical differences between these two require more study.
Neuroimaging: fMRI
Korponay et al., 2024. Brain-wide functional connectivity artifactually inflates throughout functional magnetic resonance imaging scane. Nat. Hum. Behav.
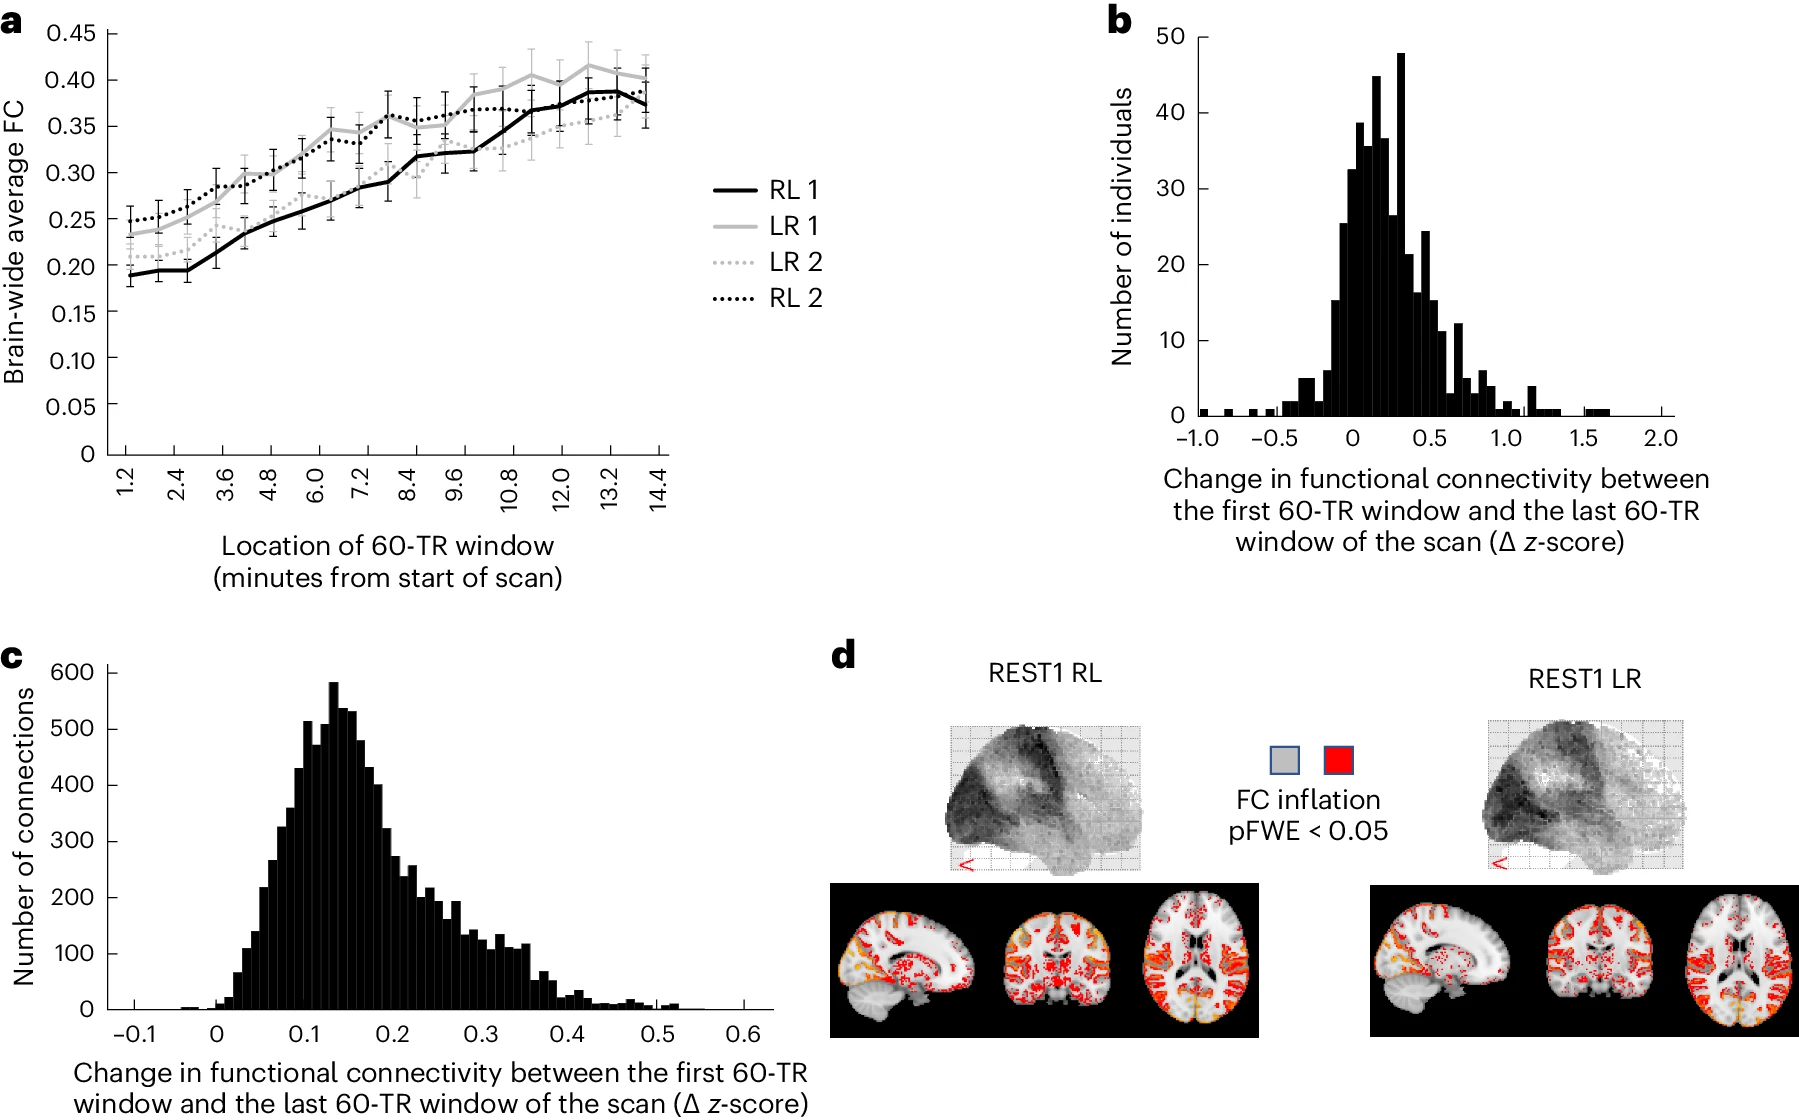
It is usually assumed that within each fMRI scan, the blood-oxygen-level-dependent (BOLD) signal is temporally stable after sufficient denoising, such that static FC or dynamic components can be estimated without further consideration of temporally structured noise. This study presented that, however, such noise may be present in the brain, even in resting-state fMRI.
- Brain-wide FC values increases with time in resting-state scans in two independent datasets. On average, the ending part of the rs-fMRI timeseries has an 71% increase in FC values than the starting part.
- Most implicated brain regions in FC inflation are the senserimotor cortex, superior temporal cotex, and occipital lobe.
- The FC inflation is present both before and after preprocessing and is thus not an artifact from preprocessing. It is also present in scans where subjects were instructed to fall asleep; so the inflation is unlikely a consequence of habituation or accumulating engagement.
- The systemic low-frequency oscillation (sLFO) signal inflates over time in a similar fashion and has similar spatial distribution in the brain as the FC inflation, with a correlation of $R = 0.63 \text{–} 0.64$. Removal of SLFO signal reduces FC inflation drastically.
- The sLFO signal is correlated with arousal, respiration, and heart rate.
- The FC inflation has negligible impact on between-scan reproducibility or subject discriminability.
Thoughts: the FC inflation or sLFO signal could be an individualistic arousal signature. Is it truly a noise and bears no behavioural relevance? Depending on the research question, it may be better to not remove the sLFO signal in some cases.
-
Tavor et al., 2016. Task-free MRI predicts inividual differences in brain activity during task performance. Sci. https://doi.org/10.1126/science.aad8127. ↩
-
Sripada et al., 2019. Basic units of inter-individual variation in resting state connectomes. Sci. Rep. https://doi.org/10.1038/s41598-018-38406-5. ↩
-
Sripada et al., 2020. Toward a “treadmill test” for cognition: Improved prediction of general cognitive ability from the task activated brain. Hum. Brain Mapp. https://doi.org/10.1002/hbm.25007. ↩